

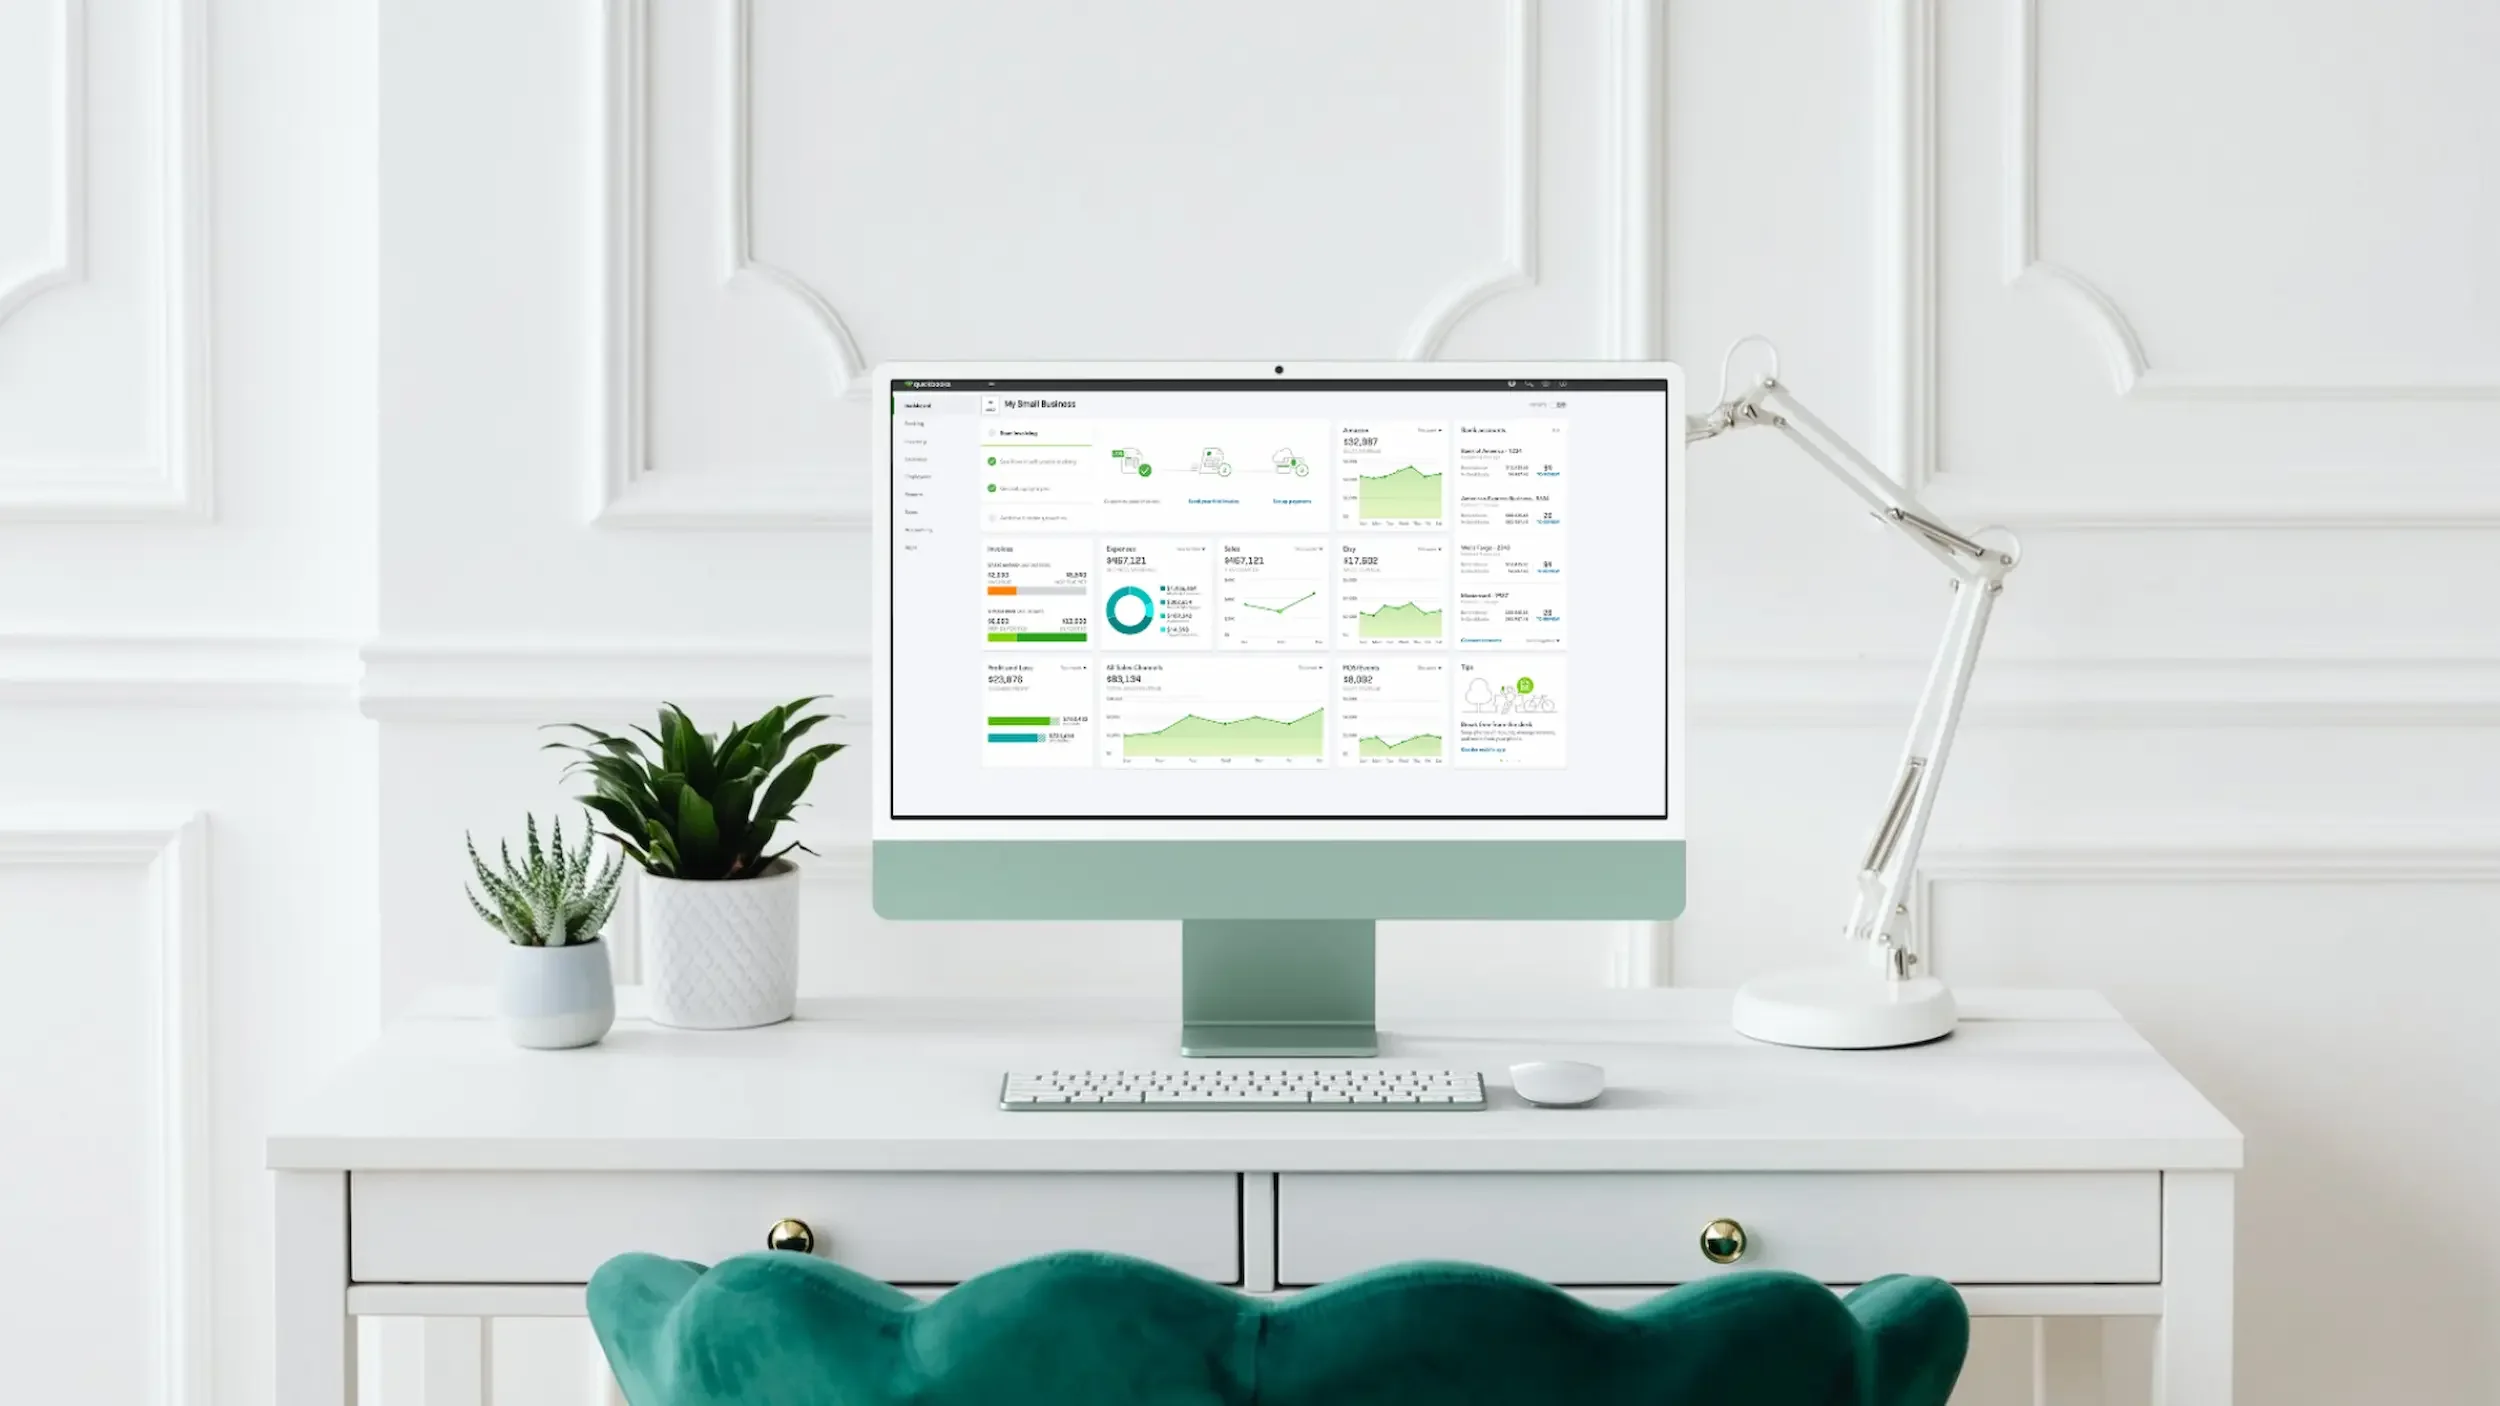
Financial Dashboards
Data is only powerful if you can understand it. I bridge the gap between complex accounting and clear business strategy by creating custom visual dashboards. By turning your raw QuickBooks data into intuitive charts and graphs, I provide the real-time visibility you need to track your performance, monitor your goals, and make every decision with absolute confidence.
24/7
ON-DEMAND DATA ACCESS
80%
FASTER FINANCIAL INTERPRETATION
100%
GOAL ALIGNMENT & ACCURACY
What We Do
Transforming Data Into Visual Strategy
Static spreadsheets only tell half the story. I provide the visual tools you need to see your business performance in real-time, allowing you to stop digging through rows of data and start leading with vision. My dashboard services focus on:
Real-Time Revenue Tracking: See exactly where your income is coming from and identify your most profitable channels at a glance.
Visual Expense Management: Monitor your spending categories through intuitive charts to ensure your burn rate stays within your budget.
KPI & Goal Monitoring: Set specific financial targets and track your progress daily so you always know if you are on pace to hit your year-end goals.
Cash Flow Heat Maps: Understand the peaks and valleys of your cash cycle with visual indicators that predict future liquidity needs.
Custom Performance Reports: Receive high-level executive snapshots that highlight the exact metrics that matter most to your specific industry.

WHY INVEST IN FINANCIAL DASHBOARDS?
Why Choose Us?
Clarity You Can See
Custom-Built for Your Business: I don't believe in one-size-fits-all. Your dashboard is tailored specifically to the metrics that drive your success.
Seamless QuickBooks Integration: No manual data entry required. Your dashboard pulls directly from your reconciled QBO data for 100% accuracy.
Simplified Decision Making: I remove the "math fatigue" by presenting your financial health in a way that is easy to interpret and act upon instantly.
Mobile-Ready Insights: Access your business vitals from your phone or tablet, giving you the freedom to monitor your health while on the go in Temecula or beyond.

Our Dashboard Services Include:
Our Dashboard Services Include:
Custom Metric & KPI Design
We identify the Key Performance Indicators (KPIs) that actually drive your business—whether it's customer acquisition cost, average order value, or gross margin—and put them front and center.
Your dashboard is built around your specific industry needs, ensuring you aren't distracted by "vanity metrics" that don't impact your bottom line.
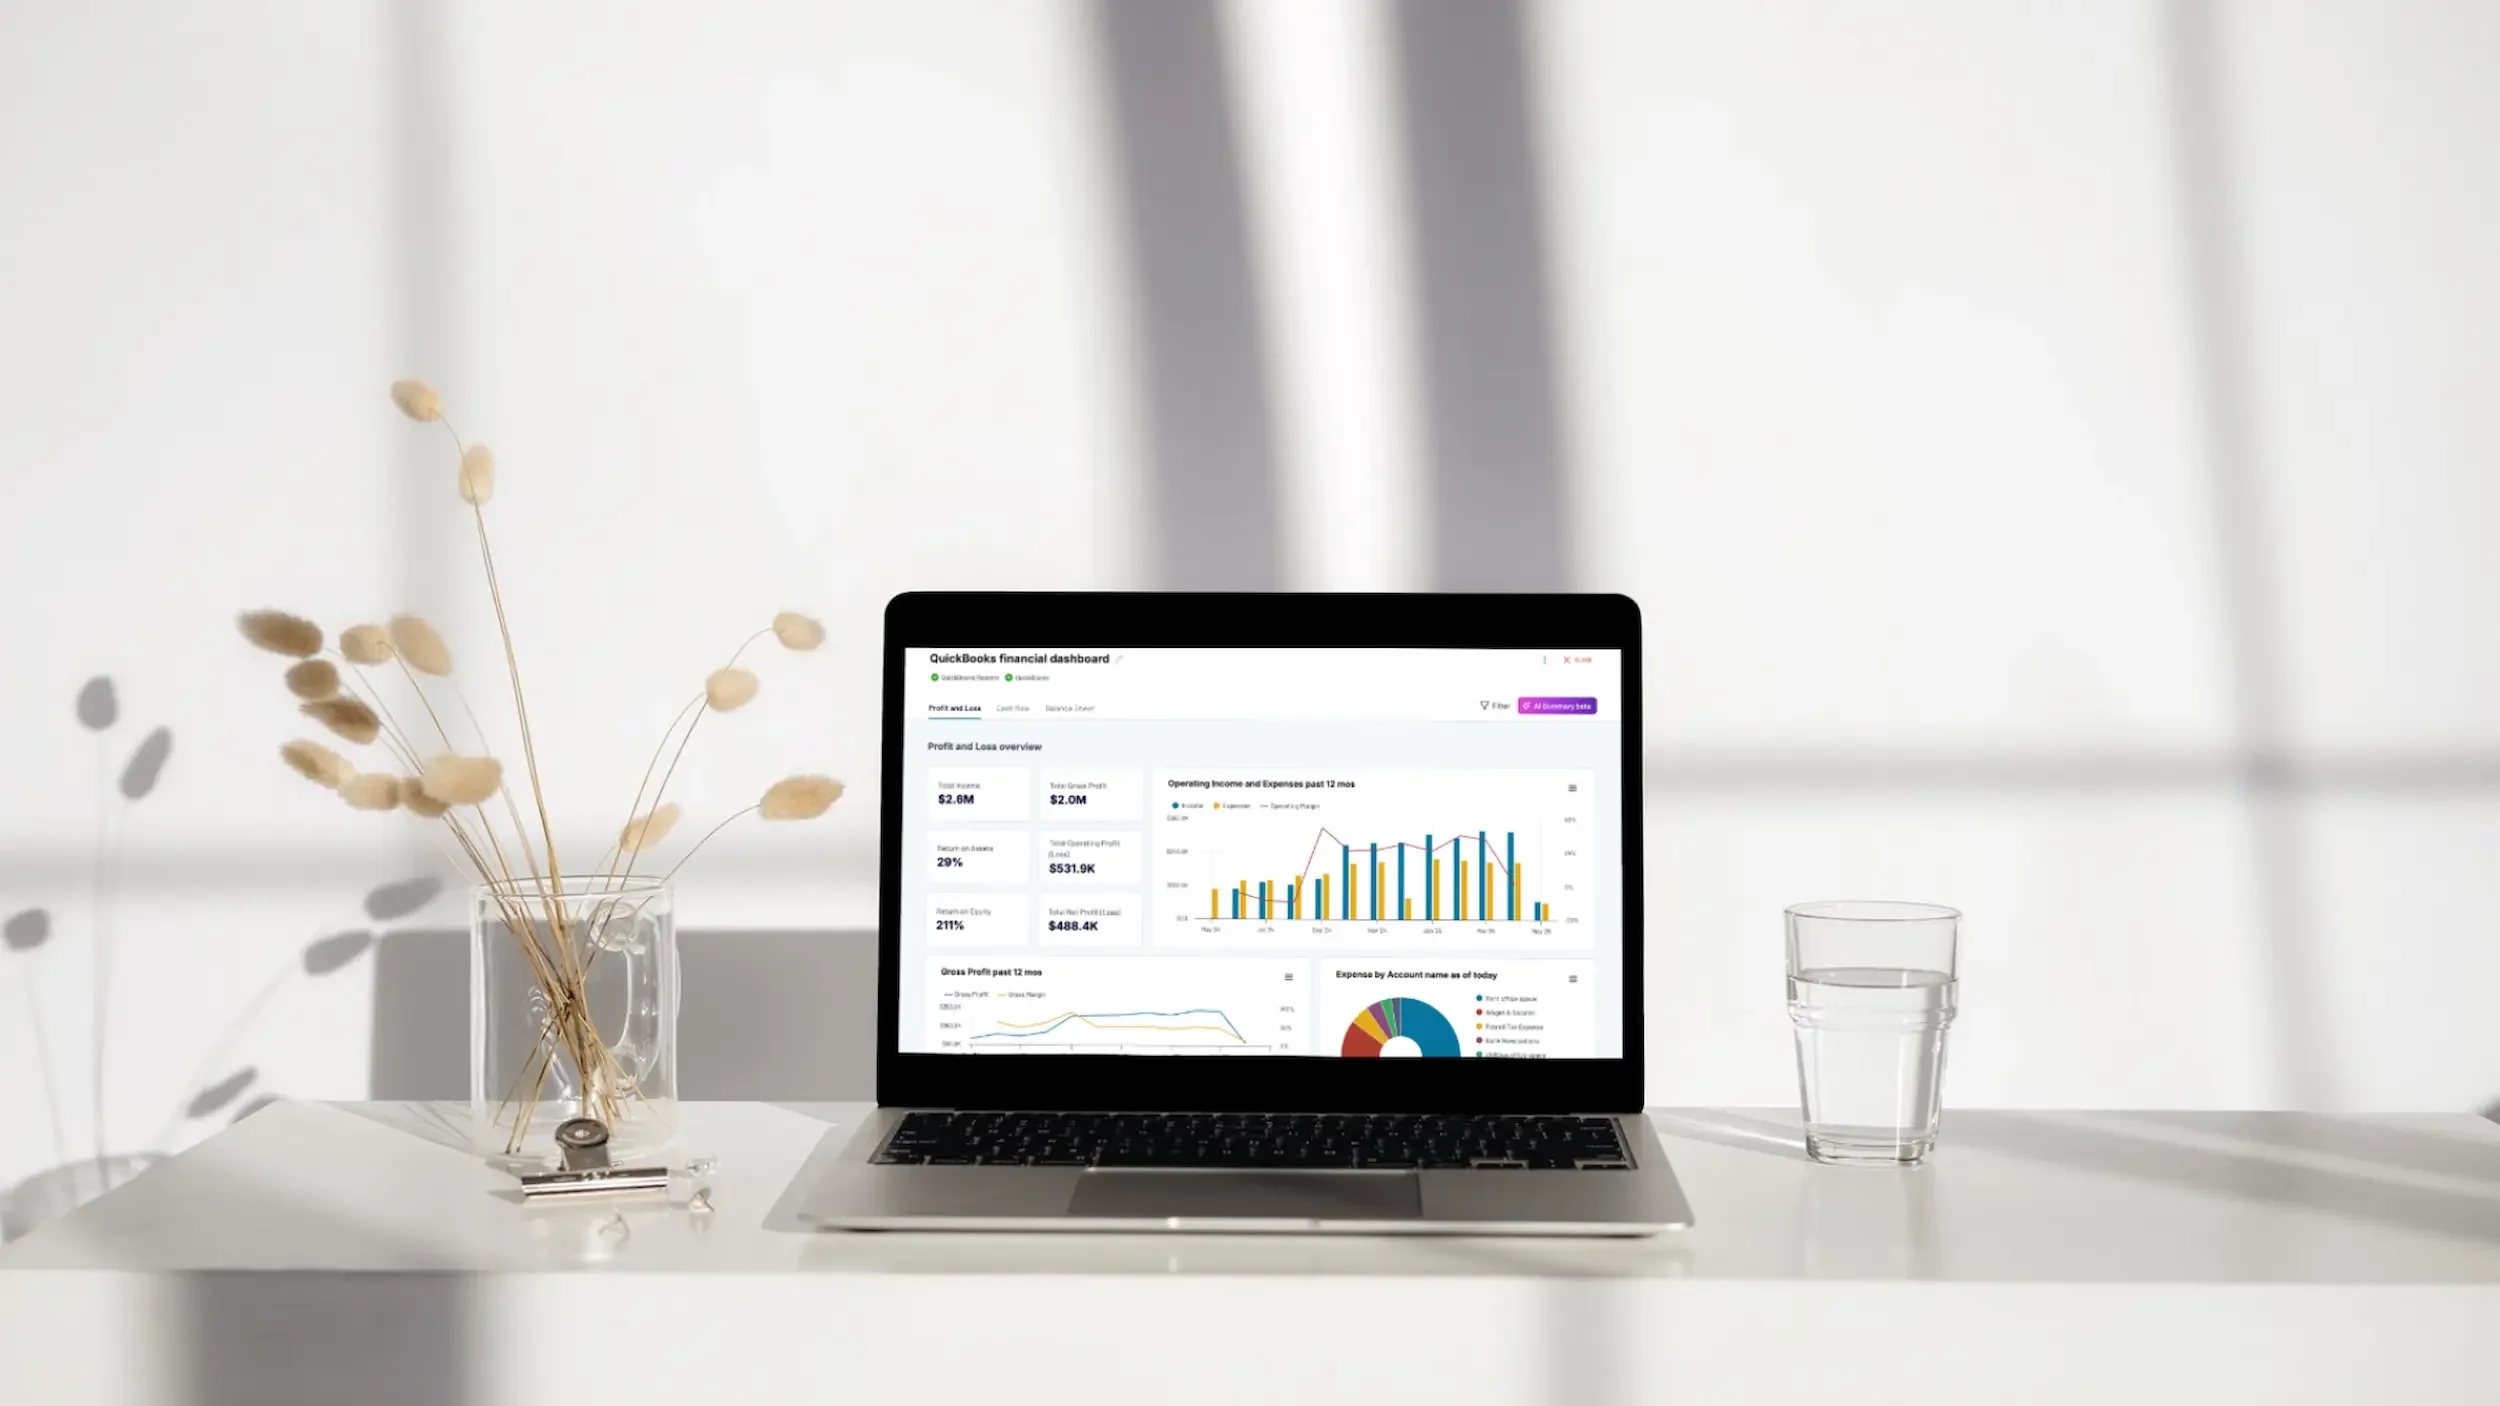
Real-Time Revenue & Profit Analysis
We create visual breakdowns of your income streams, so you can see at a glance which products or services are your top performers.
Monitor your net profit in real-time to ensure your business remains healthy and sustainable throughout the month.
Expense & Burn Rate Monitoring
Stop wondering where the money went. We categorize your spending into intuitive visual charts so you can spot "leaks" or budget overages instantly.
Track your monthly burn rate and cash reserves to ensure you always have the liquidity needed for operations and future growth.
Budget vs. Actual Visuals
We sync your QuickBooks budget with your live data, providing a clear "Progress Bar" for your financial goals.
Gain the immediate insight needed to pivot your spending or sales strategy if you see yourself drifting off-course.
Trend Forecasting & Projection
Use historical data to visualize future trends. Our dashboards help you see where your business is heading, not just where it’s been.
Plan for seasonal shifts and major investments with data-backed confidence.
Frequently Asked Questions
-
No additional software purchase is typically required. I build your custom dashboards to sync directly with your existing QuickBooks Online account. We use secure, cloud-based tools that allow you to access your visual reports from any web browser or mobile device without extra overhead.
-
Your dashboard is designed to provide real-time or near real-time insights. As soon as transactions are reconciled in your QuickBooks account, the data flows through to your visual charts. This ensures that you are always looking at the most current version of your financial health.
-
Absolutely. Every business has different priorities, so we don't use a "one-size-fits-all" template. During our initial setup, we identify the Key Performance Indicators (KPIs) that matter most to your specific goals—whether that’s tracking specific project profitability, monitoring your burn rate, or following sales trends.
Trusted by Local Business Owners


Let’s get your business moving forward.
No more guessing and no more financial fog. Let’s get your books in order and your systems streamlined so you can get back to the work you actually love. I’m ready to help whenever you are.